KPI chart cards
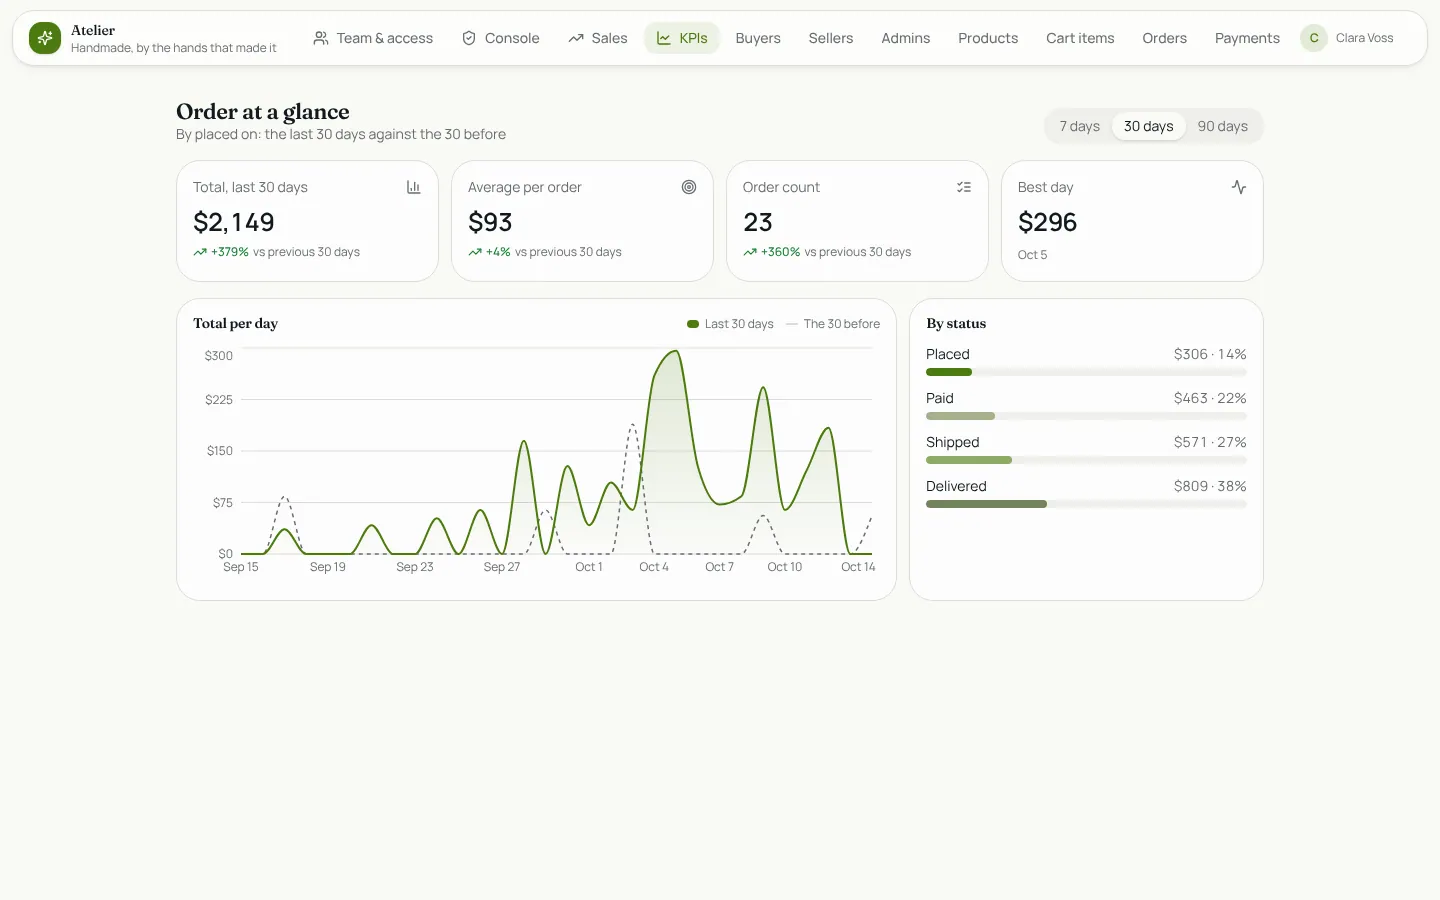
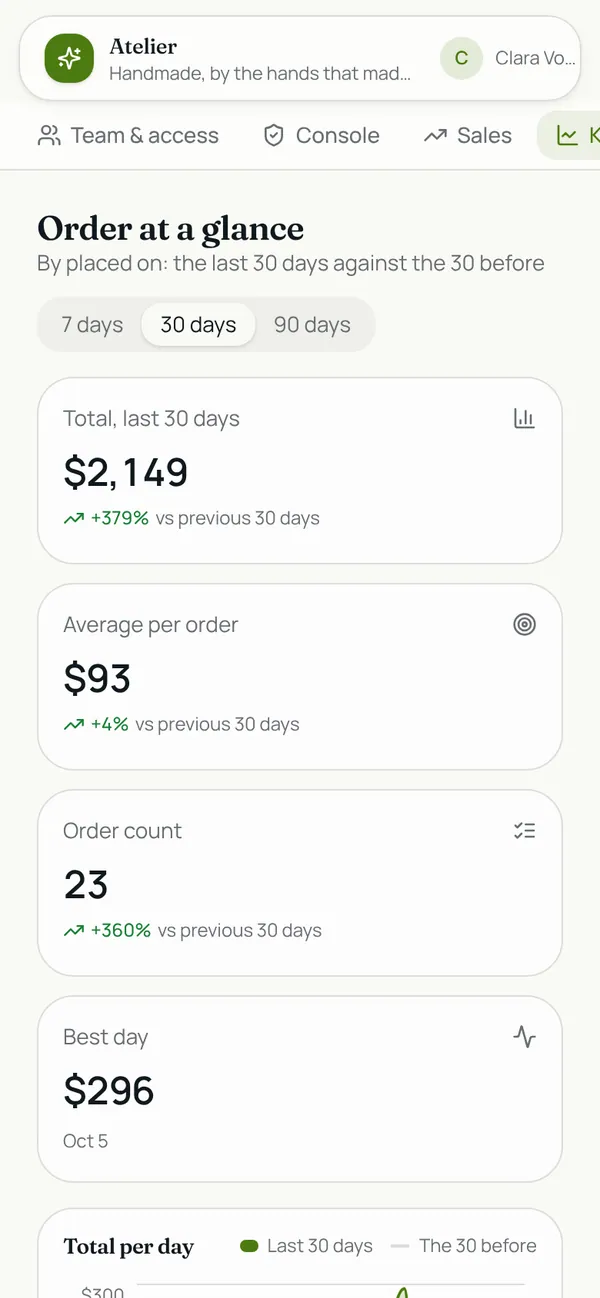
A custom component for a dashboard: pick a table, the number to add up (an amount, a total, a duration) or just count rows, and the date that places them. It shows the total, the average and the count for the last 7, 30 or 90 days with the change against the same number of days before, the best day, a per-day (or per-week) area chart of this period over a dashed line for the period before, and a breakdown by a choice field such as status or category. Money, plain numbers and percentages are formatted for you, in your app's colours, light or dark, and every number counts only the rows the viewer may see.
What it adds to your app
Component KpiCards (props: entity, valueField, dateField, groupField, format, currency, days). A KPIs page for the role you choose.
Pages
/kpisKPIs (‹page_role›)
Components
KpiCardsKPI cards and a trend chart for ‹entity›: the total, average and count over 7, 30 or 90 days with the change on the period before, a per-day trend against the previous period, and a breakdown by a choice field
Set it up
It merges into the contract of an app you already have. Nothing is overwritten: a name you already use is refused until you pass a prefix.
- Pick the project
Use the button above, or ask your coding agent with the Appbricx MCP server connected (quickstart).
- Point it at your tables and roles
Leave out the ones with defaults; a wrong one is refused with the options your app has.
Param What it is Example entityThe table whose rows the cards add up or count. ordervalue_fieldOptional: a number field to total and average (an amount, a price, minutes). Leave it out to count rows. Optional. totaldate_fieldThe date that places a row in a period. Optional. placed_ongroup_fieldOptional: a choice field for the breakdown, such as status or category. Optional. statusformatHow the number reads: number, currency or percent. Optional. currencycurrencyThe ISO currency code when the format is currency. Optional. EURpage_roleThe role the KPIs page is for. Optional. admin - Preview, then apply to dev
A dry run shows the diff and the check report; applying it changes your dev environment only.
- Deploy
When dev looks right, deploy. Production gets a snapshot first, so you can roll back.
Use it with your coding agent
The agent reads the template, runs a dry run, shows you the diff and applies it.
Add the KPI chart cards template (slug "chart-cards") to my Appbricx project. Read it with get_template, run use_template with dry_run first and show me the diff, then apply it. Ask me where it attaches if you can't tell from my contract (entity: table to measure; value_field: number to add up (optional); date_field: date field; group_field: break down by (optional); format: number format; currency: currency; page_role: who sees the cards).{
"tool": "use_template",
"arguments": {
"slug": "chart-cards",
"project_id": "<your project id>",
"params": {
"entity": "order",
"value_field": "total",
"date_field": "placed_on",
"group_field": "status",
"format": "currency",
"currency": "EUR",
"page_role": "admin"
},
"dry_run": true
}
}appbricx templates use chart-cards --param entity=order --param value_field=total --param date_field=placed_on --param group_field=status --param format=currency --param currency=EUR --param page_role=admin --dry-runGoes well with
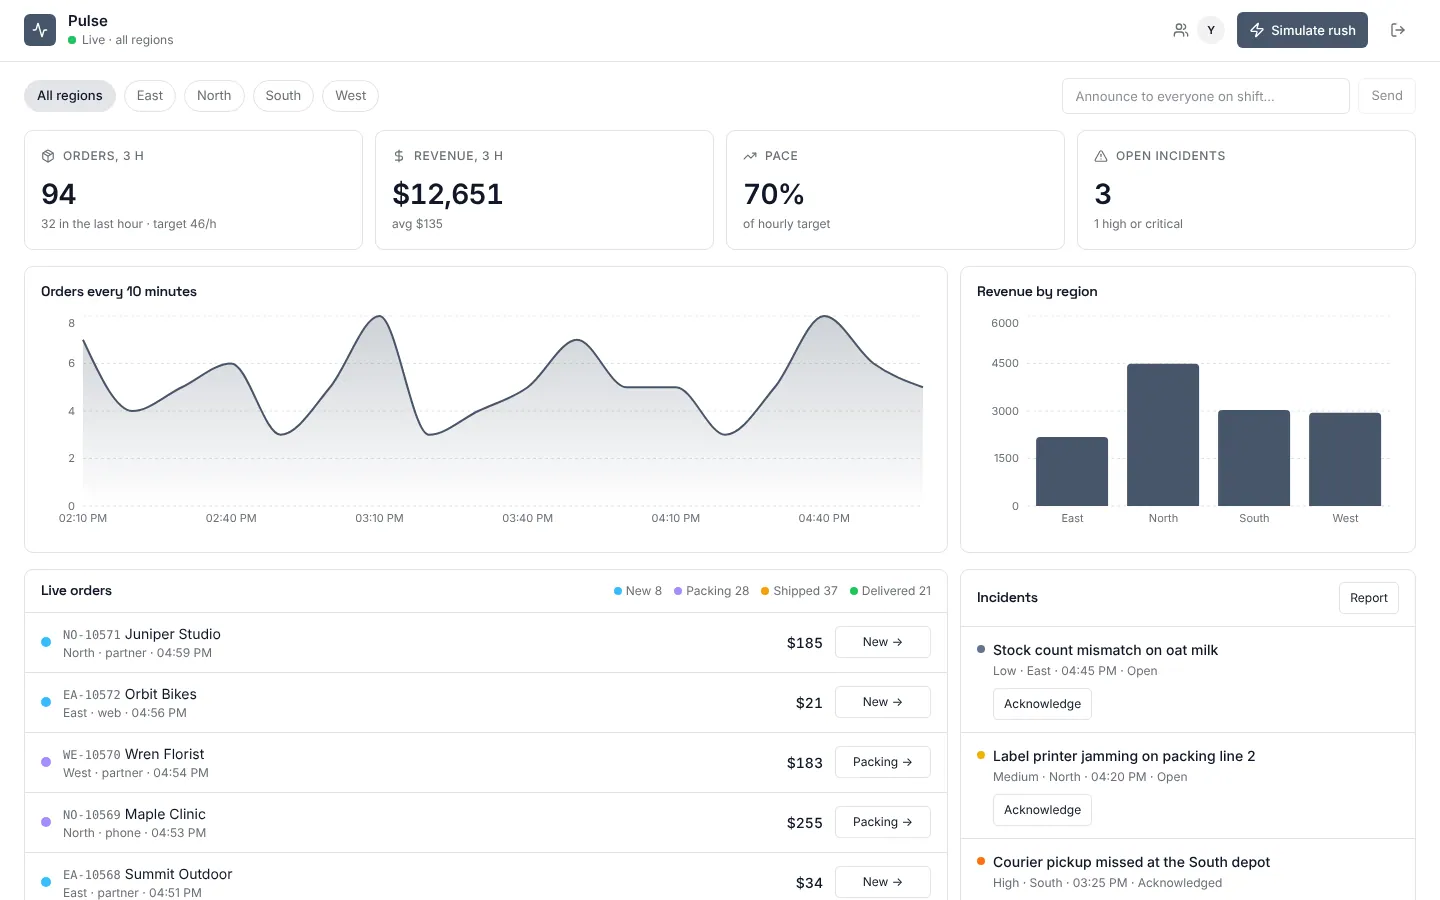
Pulse
Live operations dashboard: orders, revenue and incidents that update as they happen, with region leads who see only their own region.
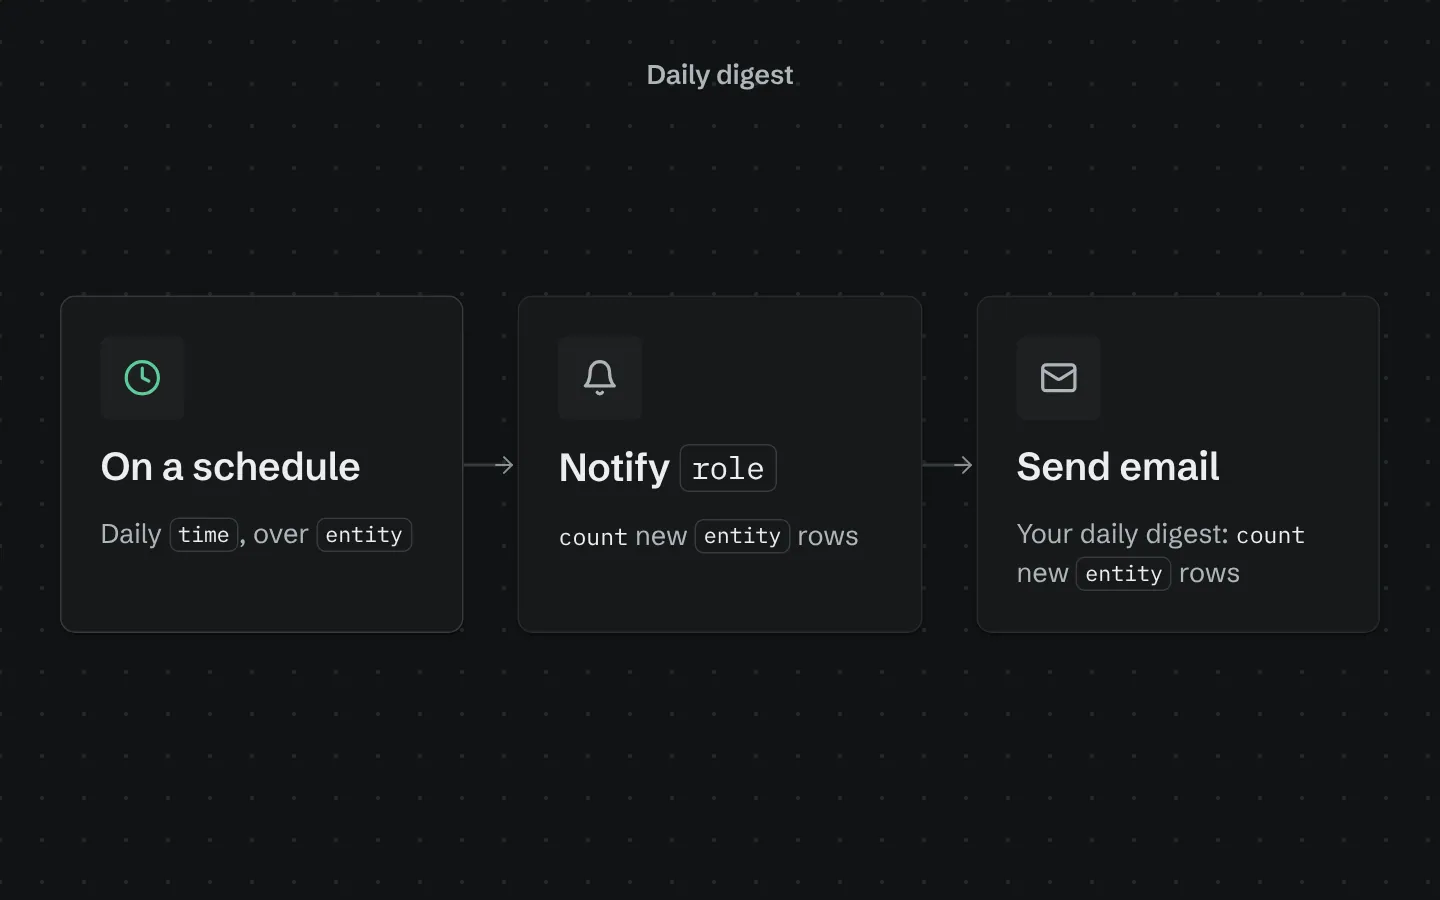
Daily digest
Every morning, sends your team a digest of yesterday's new rows in one table, in-app and by email.
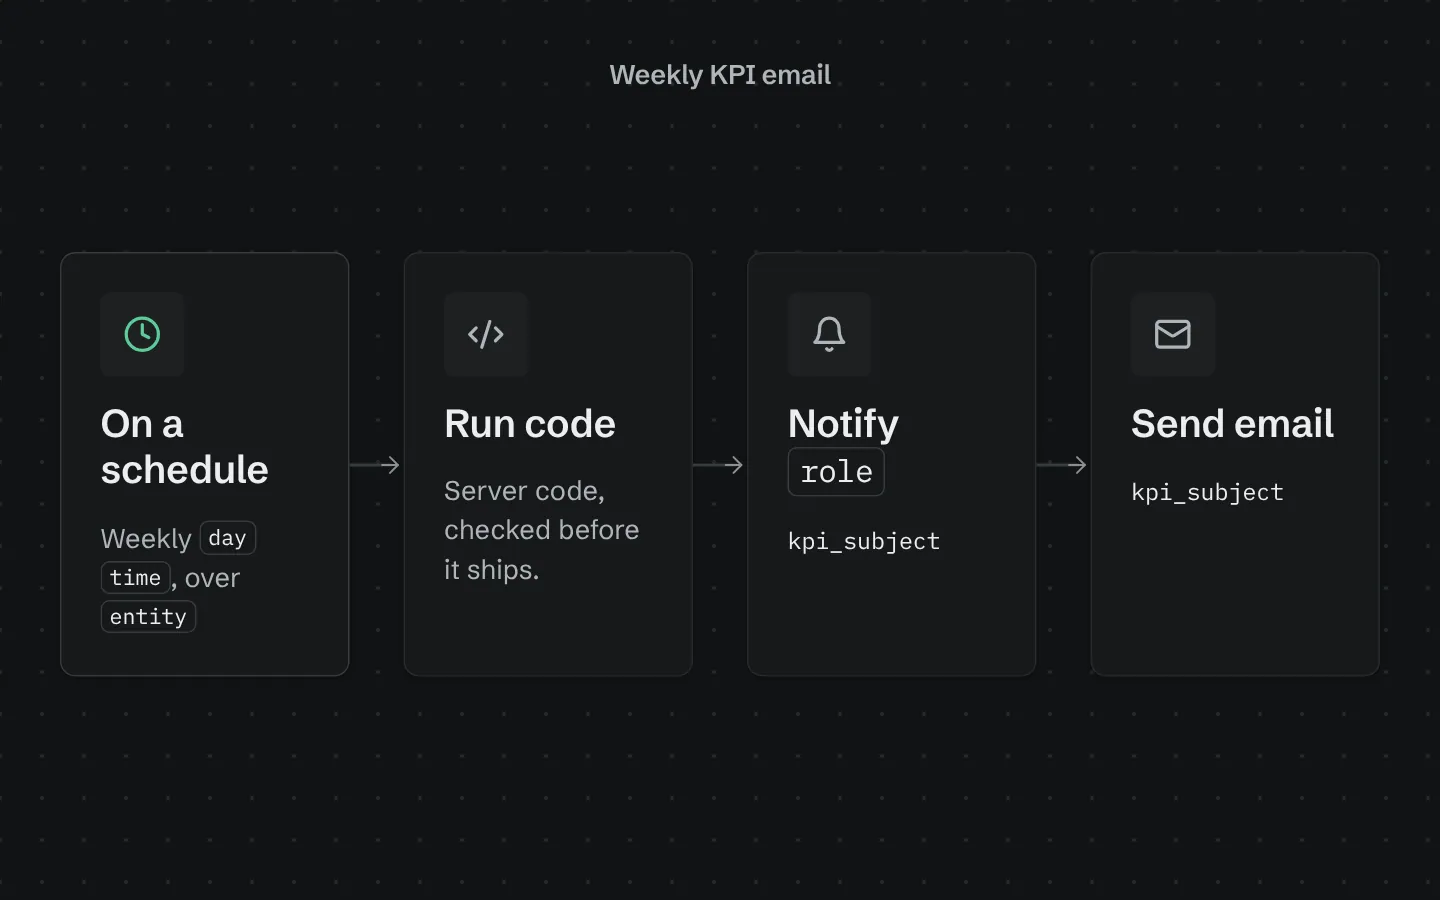
Weekly KPI email
Every week, emails your team this week's numbers for one table against the week before: count, total, average and a breakdown.